

Custom Dashboard Development: Solutions Built for Your Business
Published on

Custom Software

Quick summary
Custom dashboard development, as presented in this article, helps businesses measure, analyze and steer their performance through tailor-made web dashboards. CyberPerformance starts by clarifying the organization’s strategic objectives and involving the stakeholders, so the dashboard becomes a genuine management tool rather than a random pile of charts.
The agency then defines the users of the dashboard (executives, department heads and so on) and adapts the view, the level of detail and the consultation frequency to each profile. Particular care goes into choosing the KPIs, deliberately limited to 5 to 8 key indicators aligned with the company strategy, whether they are financial, commercial or organizational.
On the technical side, CyberPerformance selects and connects your internal and external data sources (SQL databases, ERP, CRM, Google Analytics, marketing tools and so on) thanks to deep expertise in API integration. Dashboards are built with web technologies such as PHP and JavaScript, backed by visualization libraries (Chart.js, D3.js and others) to produce dynamic charts that are responsive and suited to each industry.
Usability and UX/UI design sit at the heart of the process so your data is immediately understandable, with a clear visual hierarchy and straightforward visualizations. Finally, the agency handles deployment, user training, the definition of update frequencies and ongoing support, turning the dashboard into a true strategic co-pilot for your small business.
Jump to a section
- Understanding your business needs
- Choosing the right performance indicators (KPIs)
- Selecting and connecting your data sources
- Designing a custom dashboard
- Building a clear and intuitive interface
- Integrating with your existing systems
- Deploying and maintaining the dashboard
- Why choose CyberPerformance for your project
- Conclusion
- FAQ
Custom dashboard development, as presented in this article, helps businesses measure, analyze and steer their performance through tailor-made web dashboards. CyberPerformance starts by clarifying the organization’s strategic objectives and involving the stakeholders, so the dashboard becomes a genuine management tool rather than a random pile of charts.
The agency then defines the users of the dashboard (executives, department heads and so on) and adapts the view, the level of detail and the consultation frequency to each profile. Particular care goes into choosing the KPIs, deliberately limited to 5 to 8 key indicators aligned with the company strategy, whether they are financial, commercial or organizational.
On the technical side, CyberPerformance selects and connects your internal and external data sources (SQL databases, ERP, CRM, Google Analytics, marketing tools and so on) thanks to deep expertise in API integration. Dashboards are built with web technologies such as PHP and JavaScript, backed by visualization libraries (Chart.js, D3.js and others) to produce dynamic charts that are responsive and suited to each industry.
Usability and UX/UI design sit at the heart of the process so your data is immediately understandable, with a clear visual hierarchy and straightforward visualizations. Finally, the agency handles deployment, user training, the definition of update frequencies and ongoing support, turning the dashboard into a true strategic co-pilot for your small business.
- Understanding your business needs
- Choosing the right performance indicators (KPIs)
- Selecting and connecting your data sources
- Designing a custom dashboard
- Building a clear and intuitive interface
- Integrating with your existing systems
- Deploying and maintaining the dashboard
- Why choose CyberPerformance for your project
- Conclusion
- FAQ
Custom dashboard development has become essential for businesses that want to measure, analyze and steer their performance effectively. Data now holds a bigger and bigger place in the way a modern company is managed. At CyberPerformance, we build custom dashboards that let you see the crucial information about your operations at a glance, whether you are on site or working remotely.
Our expertise in API integration inside a dashboard lets you connect the systems you already own without adding useless sensors. You can therefore put your data to work, take informed decisions and improve your operational performance. As the old saying goes: “what gets measured gets improved”. Our web dashboard development solutions consequently distill essential data into clear, instructive visuals designed for quick reading and faster, better decision making.

Understanding your business needs
Before we start programming a custom dashboard, we need to understand in depth what your business actually needs. An effective dashboard is not simply an assembly of charts and figures: it is a genuine strategic tool that reflects the objectives of your organization and answers the expectations of the people who use it.
Identifying your strategic objectives
Strategic objectives are the foundation of any high-performing dashboard. They are concrete targets your business is trying to reach over a three to five year horizon. Unlike operational objectives, which guide day-to-day work, these objectives shape the future of your organization and turn an abstract vision into measurable milestones.
For a dashboard to be genuinely useful, it has to be tightly connected to your business strategy. The tool must let you assess where you stand today and take informed management decisions. At CyberPerformance, we always start by analyzing your strategic objectives so that every element on the dashboard contributes to them directly.
An effective strategic objective combines three essential dimensions: a clear ambition, a defined time horizon and precise measurement criteria. Without those elements, your strategy stays a dead letter and your dashboard loses its relevance. That is why we help you frame SMART objectives (Specific, Measurable, Achievable, Realistic and Time-bound).
Involving your stakeholders
Involving the stakeholders is critical when a custom dashboard is being designed. The classic mistake? Building a tool without consulting the people who will use it every day. To avoid that trap, we map the stakeholders from the very start of the project.
This approach allows us to:
- Identify every individual or group that could have an impact on your project or be affected by it
- Understand the relationships, the influence and the interests among the different stakeholders
- Prioritize our engagement efforts so we focus on the people whose impact matters most
We generally use the power-interest matrix to sort your stakeholders into four categories:
- High influence, high interest → involve actively
- High influence, low interest → keep regularly informed
- Low influence, high interest → consult occasionally
- Low influence, low interest → monitor without excessive engagement
This map helps us anticipate the expectations and the reactions of the different players so we can adapt our development strategy. What is more, input from your staff is priceless when the time comes to pick the right performance indicators and to get your team to buy into using the dashboard.
Defining the dashboard users
For a dashboard to be adopted and used effectively, we have to know exactly who will use it and how. Our process starts with a thorough analysis of the dashboard audience, built around precise questions: “Who” is our audience? Top-level managers, CEO, senior manager? “What” do we need to communicate to that audience, and what action do we expect from them? “How” are we going to represent the data we have?
Every decision level in your organization needs a view suited to its own needs. A general manager, for example, needs a company-wide overview of performance, while a department head focuses on more detailed indicators specific to their unit.
At CyberPerformance, we adapt the programming of your dashboards to those specific users. Our API integration expertise lets us connect different data sources so each user gets exactly the information they need, in a visual format suited to their role.
We also run a thorough needs assessment to pin down usage preferences: how often the dashboard will be consulted, the visualization format, the level of detail required and so on. This user-centred approach makes sure your dashboard is not only technically solid, but also perfectly aligned with the expectations and the working habits of your teams.
Choosing the right performance indicators (KPIs)
An effective dashboard rests on relevant performance indicators. Selecting the KPIs (Key Performance Indicators) is therefore a decisive step in our process for programming a custom dashboard for your business.
Limiting the number of indicators
Faced with the abundance of available data, the temptation to multiply indicators is strong. That approach backfires. KPIs quickly become sterile once they are drowned in a crowd of other metrics. At CyberPerformance, we recommend limiting the number of indicators on your dashboard.
Good practice says a dashboard should contain no more than 5 to 8 performance indicators. This “7±2” rule maximizes the effectiveness of your dashboard while keeping it readable. The fewer indicators there are, the easier it is to make them known and recognized across your whole workforce.
It is not unusual for a decision maker to hear their teams complain about the abundance of KPIs and question how useful some of them really are. Our experience shows it is better to track 5 or 6 relevant KPIs than 20 that nobody uses. By limiting the number of indicators, you focus on the ones that add real value and that your team can actually act on.
Aligning your KPIs with your objectives
To be genuinely useful, indicators have to line up perfectly with your strategic objectives. According to a Gartner study, 70% of the businesses that focus on well-chosen KPIs reported a 30% increase in productivity. The choice of KPIs must be driven by clearly defined corporate objectives.
Our developers at CyberPerformance start by analyzing your strategic objectives before any dashboard programming begins. That step guarantees every element on display contributes directly to your company vision. When you think about the key performance indicators to include on your dashboard, think about your financial goals, your size, your maturity, your industry and your management model.
KPIs have to be SMART (Specific, Measurable, Achievable, Realistic and Time-bound). They also have to be actionable: a KPI you cannot act on will turn out to be useless. Our API integration inside a dashboard connects various systems so you can track those indicators in real time and take decisions based on objective data.
One important tip: question the relevance of your indicators at least every 3 months. If your KPIs are always in the “green”, change them. We program our dashboards to make that continuous evolution easy.
KPI examples for small businesses
Different categories of indicators may be relevant depending on your activity. Our expertise in web dashboard development lets us tailor those indicators to your specific needs:
- Financial indicators: gross margin, net margin, break-even point, cash flow. These KPIs are essential for assessing the financial health of your business and taking informed decisions about budget allocation.
- Commercial indicators: conversion rate, customer acquisition cost, customer lifetime value, retention rate. According to some studies, businesses that track their KPIs more frequently are generally able to decide faster than those who do it only occasionally.
- Organizational indicators: absenteeism rate, productivity, revenue per employee. These measures help pinpoint the room for improvement inside your departments.
At CyberPerformance, our custom dashboard programming lets you visualize those indicators through dynamic charts and intuitive interfaces. We bring in the data from your different systems (CRM, ERP, accounting and so on) through our API connections to give you one unified dashboard.
Our technical approach combines PHP and JavaScript expertise to build a dashboard that fits your needs precisely. We automate data collection so your dashboard is fed without effort. That real-time synchronization means you always have a clear, up-to-date picture of your performance.

Selecting and connecting your data sources
To build a high-performing dashboard, selecting and connecting the data sources is a foundational step. The quality of your dashboard depends directly on how reliable the information feeding it is. At CyberPerformance, we pay close attention to this critical development phase, because it determines the accuracy and the relevance of every analysis you will be able to run.
Internal versus external sources
When a custom dashboard is being programmed, we distinguish two broad categories of data sources. Internal sources come straight from your own infrastructure: SQL databases, Excel files or data pulled from your ERP and CRM. External sources, on the other hand, cover the data available on the internet or through third-party services such as Google Analytics, market research or open data.
The choice between those two types of sources depends on several factors we review with you:
- Strategic relevance: we identify which sources contribute most effectively to your main objectives.
- Data reliability: some sources have update problems that risk distorting your indicators.
- Technical compatibility: we systematically verify that the selected sources work with the chosen visualization tools.
At CyberPerformance, our expertise lets us assess the quality of every source so we can maximize the availability of your dashboard and help you take decisions backed by relevant, up-to-date data.
Connecting to a database
Connecting to databases is a crucial technical aspect of web dashboard development. Our developers know this step inside out, which guarantees a smooth and secure integration with the systems you already run.
Several types of connection are possible depending on the nature of your data. We can connect to files hosted on your computer (spreadsheets, text files), or to relational, big data or multidimensional databases sitting on your company servers. Our custom dashboard programming also supports cloud sources such as Amazon Redshift or Salesforce.
For every connection, we carefully configure the authentication and security settings. In some cases (where it is required), we implement the SSL protocol to secure data transfers and reduce the risk of unauthorized interception. Depending on the nature of your systems, we can also set up initial SQL queries to optimize performance.
Our technical approach adapts to your specific constraints: for connections that involve file data, we use UNC paths to guarantee accessibility, while taking care to optimize performance for large files.
Using third-party APIs to centralize your data
Centralizing data through APIs is one of the strong points of our dashboard programming expertise. This approach unifies information coming from multiple sources into a single, coherent and up-to-date interface.
APIs (Application Programming Interfaces) act as intermediaries that give access to specific data held by external services. For specialists handling sources from several channels, dashboards now have to be optimized to bring in multiple data sources at once.
Our API integration process follows a rigorous methodology:
- We identify the endpoints that matter for your activity
- We configure secure authentication for each API
- We build suitable error-handling mechanisms
- We put precise monitoring of API usage in place so allocation limits are respected
Using APIs brings several decisive advantages to your dashboard. First, it gives you a complete overview by merging data from different platforms. Second, it supports fast decision making by presenting the results from all your channels in one unified interface.
At CyberPerformance, our expertise in multi-system API integration lets us connect your different platforms: CRM, marketing tools, accounting systems or e-commerce platforms. The technologies we use (PHP, JavaScript) are particularly well suited to building dynamic dashboards that make full use of third-party APIs.
To guarantee optimal performance, we make a point of following data exchange best practices. For example, we generally limit API messages to 10 MB inside an organizational network and to 1 MB for those consumed over the internet, which keeps the experience smooth for everyone using your dashboard.

Designing a custom dashboard
Designing a personalized dashboard is the stage where our technical expertise really comes into its own. Once the objectives are set, the KPIs selected and the data sources identified, it is time to turn all of that into a working visual solution. This crucial phase determines how effective your decision-making tool will ultimately be.
Using web frameworks (PHP, JavaScript)
Choosing the technology is a strategic decision in dashboard programming. At CyberPerformance, we favour an architecture that combines PHP on the backend with JavaScript on the frontend, which strikes an optimal balance between performance and interactivity.
PHP handles server-side work efficiently: data aggregation, authentication and backend processing. JavaScript, for its part, lets users manipulate data visualizations in real time for a smooth, responsive user experience.
Several frameworks stand out for building high-performing dashboards:
- jQuery: this library changed the way people write JavaScript and considerably simplifies animation and event handling, opening a wide range of possibilities for your projects.
- React: this JavaScript library is recognized for building interactive user interfaces in which each component works on its own.
- Symfony: this French PHP framework stands out for its exceptional flexibility. Fully configurable, it lets you build a site that matches your requirements as closely as possible.
We carefully select the libraries that specialize in data visualization, such as Chart.js or D3.js, to create dynamic charts that present your KPIs clearly.
Dashboard development for a web application
Building an effective web dashboard demands a methodical approach. First, we design dashboards that let you see the essential data quickly, whether you are on site or remote. That accessibility is a major asset for decision making.
Our developers put specialized libraries such as Gridster.js or Packery to work to create flexible dashboard layouts. Those tools make it possible to design interfaces where the information follows a logical visual hierarchy, with precise headline figures and opportunities to dig deeper.
Personalizing your dashboard is far more than a question of aesthetics: it is an indispensable practical need. A personalized dashboard gives you a clear, concise overview of the critical aspects of your activity.
We also build in advanced features:
- Customizable alert systems so you hear about significant variances
- The ability to export data in different formats
- Views adapted to the different device types (responsive design)
Adapting to the specific needs of each company
Every industry brings its own challenges. We therefore adapt our solutions to the particulars of your business as a matter of course. In the construction sector, for example, we build in essential features such as tracking resources and materials, managing timelines, or monitoring safety and compliance.
At CyberPerformance, we create dashboards that mirror the reality and the specific working methods of your company. That personalization helps you put a suitable strategy in place by taking the variances into account and adjusting your actions accordingly.
API integration is one of our main strengths. We can connect your dashboard directly to the machines you already own, without adding useless sensors. Our team reaches your equipment data whatever language it speaks, so you get a clear, personalized view of your key indicators.
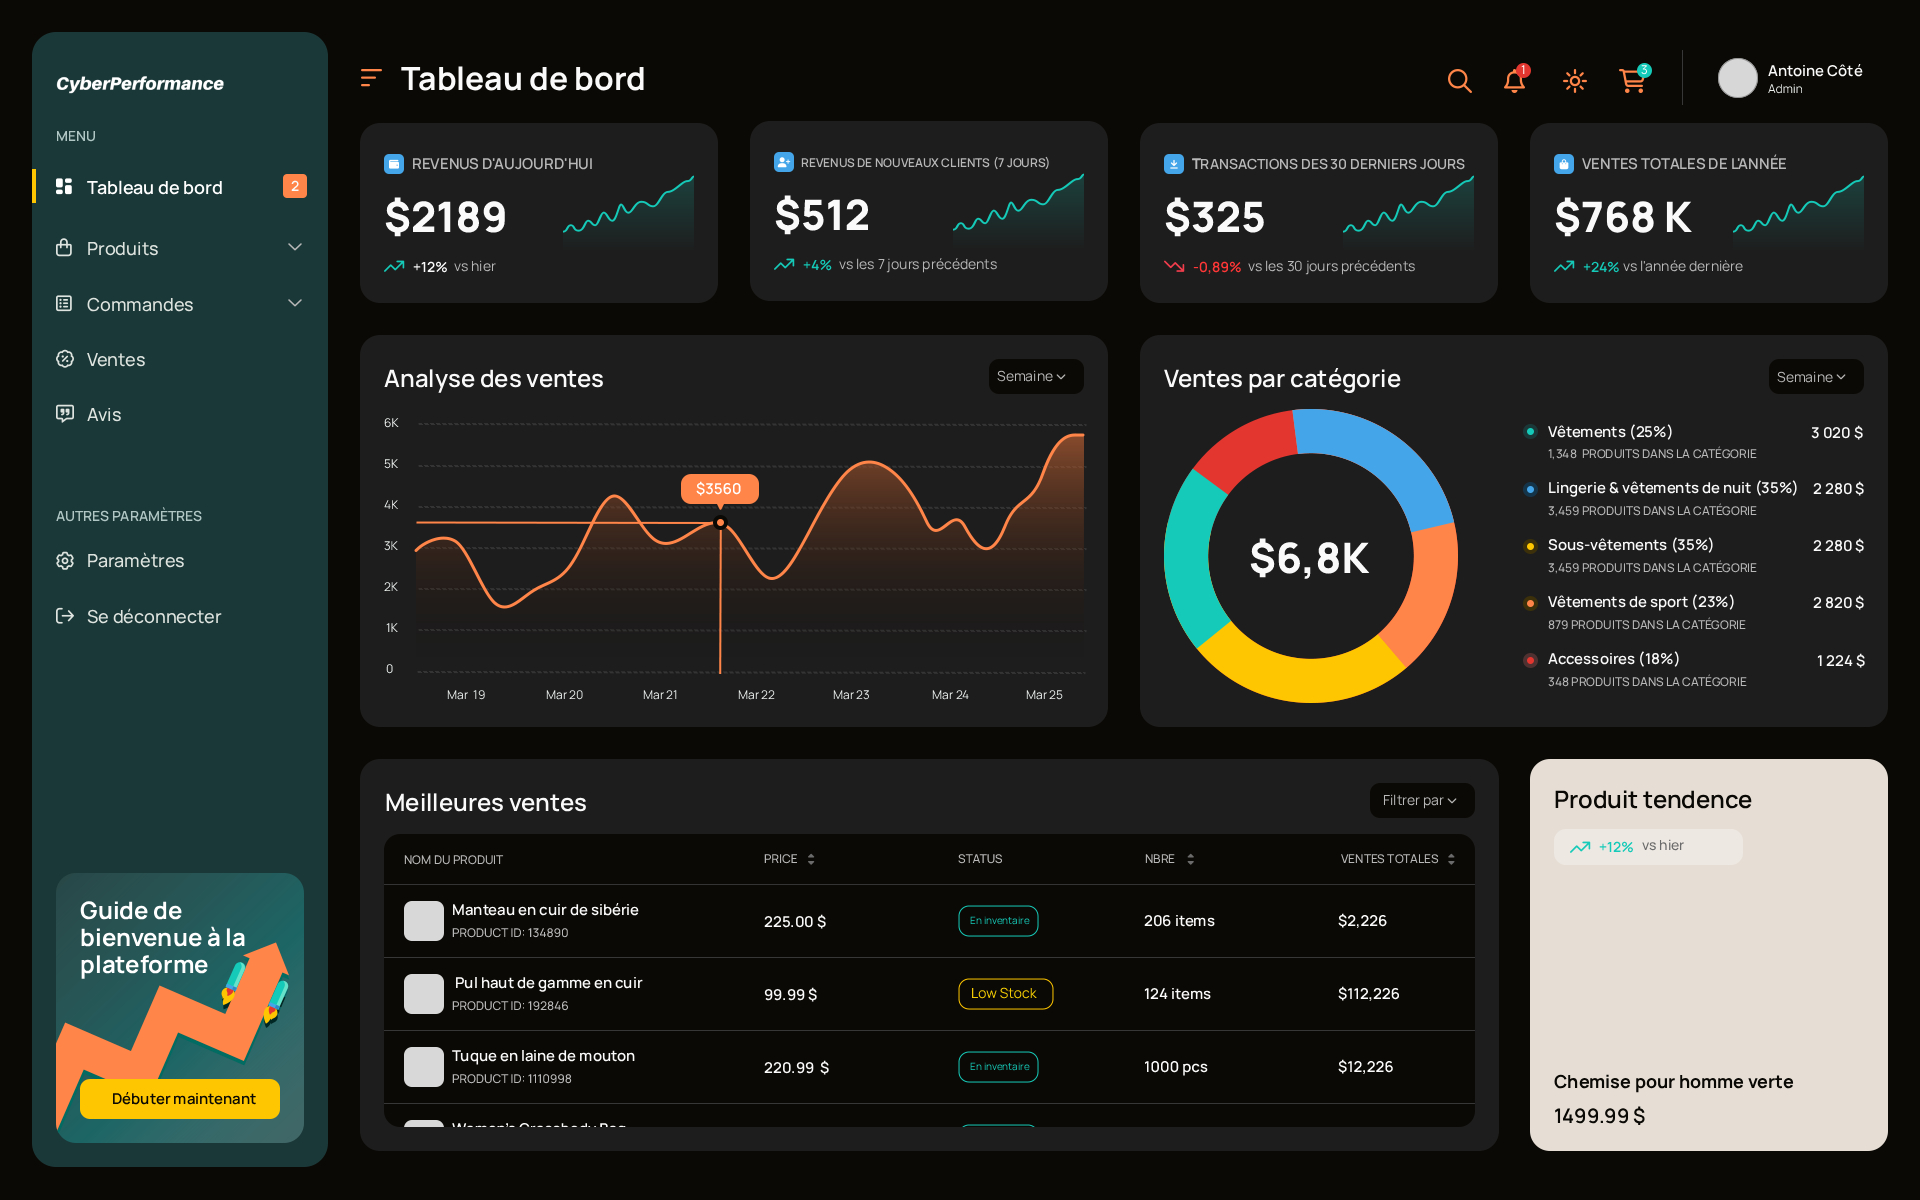
Depending on your industry, we adapt the widgets on your dashboard: pie charts for financial forecasts, task lists for project management, or trend charts for sales tracking. This tailored approach guarantees your dashboard answers your day-to-day operational needs precisely.
Our proven methodology lets us design a tool that not only presents your data clearly, but genuinely becomes a strategic lever for your growth. The complete personalization we offer is built so your dashboard can evolve more easily alongside your business.
Building a clear and intuitive interface
The visual side of your dashboard plays a decisive role in how effective it turns out to be. A technically perfect but visually confusing dashboard will be underused. At CyberPerformance, we pay particular attention to creating interfaces that turn complex data into information you can act on quickly.
UX/UI design principles
Designing effective interfaces rests on fundamental principles we apply systematically in our dashboard programming. A well-considered visual hierarchy guides the attention of your users toward the most critical information first. We use layout, colour and typography strategically to highlight the priority data while minimizing distractions.
To keep your dashboard readable, we follow several essential rules:
- Use adequate contrast between the text and the background
- Use different font sizes and weights to establish a clear hierarchy
- Keep a consistent style across the whole dashboard
We also divide your dashboard into digestible sections using panels. Like the chapters of a book, those sections group related information by theme. We can dedicate one section to sales performance indicators and another to customer engagement, creating a logical flow that tells the story of your data.
Choosing your dynamic charts
Picking the right visualizations is a crucial step in turning raw numbers into insight you can act on. Every type of data calls for a specific visualization format. We follow precise rules: bar charts for comparisons, line charts for trends over time, and pie charts for proportions.
Simplicity remains our absolute priority. We steer clear of 3D charts, which can distort how the data is interpreted. Our expertise in dashboard programming with PHP and JavaScript lets us implement interactive charts that give users the ability to explore the underlying data with a single click.
We also adapt the colour palette to differentiate the categories and signal the relationships between data points. Bright colours are reserved for highlighting anomalies or urgent information that needs immediate attention. This structured use of colour considerably improves the readability of your custom dashboard.
Integrating with your existing systems
Integrating a dashboard smoothly with the information systems you already run is a technical challenge we handle with confidence at CyberPerformance. This crucial step determines the real added value of your data visualization solution.
Compatibility with the tools already in place
Our dashboard programming expertise lets us guarantee optimal compatibility with your current IT ecosystem. We build custom connectors that talk to your business applications, whether they are ERP, CRM or proprietary management systems. This approach avoids costly breaks in your established processes.
Every company has its own technology landscape. That is why we systematically run a compatibility audit before any development begins, which identifies the technical constraints and the integration opportunities. Our team is particularly at home with:
- Standard communication protocols (REST, SOAP, GraphQL)
- Exchange formats (JSON, XML, CSV)
- Secure authentication systems (OAuth, SAML, JWT)
We also help you identify the tools compatible with the features your custom dashboard requires, which guarantees a smooth and durable integration.
SaaS dashboard programming
SaaS dashboard programming gives your business unmatched flexibility. This approach lets you reach your dashboard from any connected device, with no complex local installation. Our expertise in PHP and JavaScript web development lets us build robust, scalable cloud solutions.
We design secure multi-tenant architectures in which each client gets an isolated, protected environment. The aim is to protect the confidentiality of your data while optimizing performance. Updates are deployed automatically and scheduled so they have as little impact as possible on your daily operations.
Our SaaS dashboard programming also includes advanced access-rights management, which lets you define precisely which information each employee can see based on their profile.
Real-time synchronization
In a business environment where responsiveness is everything, real-time synchronization of your dashboard becomes a decisive competitive advantage. Our API integration expertise lets us build two-way connections between your systems and your dashboard.
The technologies we implement, such as WebSocket or Server-Sent Events, make it possible to update your key indicators in near real time, when network and system conditions allow. Any change in your source systems is reflected immediately on your dashboard, which lets you take decisions based on the most recent data.
Finally, we optimize synchronization performance with advanced caching and asynchronous processing techniques. Those methods keep the user experience smooth while minimizing the load on your information systems, even during activity peaks.
Deploying and maintaining the dashboard
Deploying a dashboard does not mark the end of the project, but rather the beginning of its operational life cycle. At CyberPerformance, we give enormous importance to this phase, because it determines the long-term success of your solution.
User training
Input from your staff is priceless when the time comes to choose the right indicators and the right dashboards. Their participation also helps you get your team to buy into using the dashboard. We offer several training formats to suit your needs: in-person sessions, live online training and free tutorial videos. Those resources let your teams sharpen their skills quickly.
To ensure the best possible adoption, we run sessions as soon as the tool launches, produce practical guides and, above all, explain the logic behind every indicator: where the data comes from, how it is calculated and what the variations mean. This teaching approach ensures your custom dashboard is genuinely put to work.
Setting the update frequency
A dashboard has to be updated frequently: daily, weekly or monthly, depending on the specific needs of your business. The ideal frequency depends directly on how the dashboard is used operationally. A financial dashboard, for example, generally needs a quarterly or semi-annual update, while a sales dashboard benefits from daily or weekly refreshes.
It is essential to establish a clear data refresh process from the outset, ideally an automated one. Our dashboard programming defines precisely who is responsible for the update and how often, and implements alerts when it falls behind. That discipline avoids the trap of stale data, which can lead to bad decisions.
Technical support and scalability
Our technical support commitment covers systematic application maintenance, fast intervention when critical malfunctions occur, and a transfer of knowledge to your internal team for minor maintenance. Thanks to our expertise in API integration inside a dashboard, we put synchronization mechanisms in place between your different systems so your data stays aligned as often as possible.
For every major intervention (fixes, new configurations or migrations) we provide a detailed report that guarantees traceability and transparency. Alongside your internal dashboards, those reports give a clear picture of the changes made to your solution.
Working with CyberPerformance gives you the kind of support that encourages a culture of continuous improvement, reinforced by regular discussions about how your dashboard is performing.
Why choose CyberPerformance for your project
By choosing our expertise for your custom dashboard development, you get a complete service that combines technical mastery with a deep understanding of the realities Quebec businesses live with every day.
Expertise in custom programming
Our team at CyberPerformance holds sharp expertise in web dashboard development built specifically for small and medium businesses. Unlike generic solutions, we can connect your dashboards directly to the machines you already own, without adding superfluous sensors. We reach your equipment data whatever programming language it uses, which makes for a perfect fit with your current technical infrastructure.
Our rigorous methodology begins with an in-depth analysis phase before any business dashboard programming starts. The aim of that approach is to design a solution closely aligned with your specific needs, rather than a generic tool poorly suited to your context.
Multi-system API integration
Our particular expertise in API integration is one of our major assets. We build specific connectors between your different applications, which makes information circulate smoothly between your systems. That technical mastery lets us harmonize the interactions between your various pieces of software and optimize your data flows.
Whether you use accounting software, an ERP, a CRM or assorted marketing tools, our team has the skills needed to integrate those systems into your custom dashboard. That centralization gives you a unified view of your performance.
Support from A to Z
Our collaboration always starts with an in-depth first meeting whose purpose is to pinpoint your business challenges and objectives. That crucial step lets us develop a complete strategy adapted to your reality.
Beyond the initial build, we stay by your side to optimize your tools and grow them at the pace of your business. We favour long-term relationships with our clients and put our energy into supporting them continuously as their tools evolve.
Conclusion
Custom dashboard development is now an essential strategic lever for any business that wants to steer its performance effectively. A well-designed dashboard turns complex data into information you can act on, which makes for fast, well-informed decisions.
At CyberPerformance, we put our technical expertise at the service of your business vision. Our methodical approach starts with an in-depth analysis of your strategic objectives, followed by the careful selection of 5 to 8 KPIs that genuinely matter for your activity. That deliberate limit improves the readability and the operational effectiveness of your dashboard.
We connect your dashboard to your different data sources (CRM, ERP, marketing tools, accounting systems) while making the most of the systems you already run. That centralization gives you a unified, up-to-date view of your performance, reachable from most compatible connected devices.
Beyond the technical side, visual design plays a decisive role in whether the tool gets adopted. We therefore pay particular attention to the user interface, using data storytelling to turn your numbers into coherent narratives that lead naturally to the key insights.
Support is another fundamental pillar of our offer. Far from abandoning our clients once the dashboard is deployed, we train the users, define the update processes and provide responsive technical support so your dashboard can grow at the pace of your business.
At a time when data is becoming a major competitive asset, a custom dashboard is far more than a simple reporting tool: it is a genuine strategic co-pilot for your business. Our approach rests on lasting partnerships and a long-term commitment to our clients.
Choosing CyberPerformance for your dashboard development means opting for a solution built to synchronize your existing systems effectively, to distill your critical data and to support you through the key phases of your digital transformation.
Request your free quoteFAQ
Q1. What are the key steps to building an effective dashboard? The essential steps are defining the objectives, selecting the relevant KPIs, connecting the data sources, optimizing the visual design and setting how often the information is refreshed.
Q2. What are the advantages of a custom dashboard over a generic solution? A personalized dashboard fits your specific needs precisely, integrates the systems you already run without superfluous additions, and evolves with your business. It gives you a unified, relevant view of your performance, which makes decision making easier.
Q3. How do I choose the right performance indicators (KPIs) for my dashboard? Select 5 to 8 KPIs directly tied to your strategic objectives. Make sure they are measurable, actionable and aligned with your company vision. Reassess how relevant they are on a regular basis so they stay effective over time.
Q4. How important is design when a dashboard is being built? Clear, intuitive design is crucial to how effective a dashboard turns out to be. It has to guide attention toward the essential information, use the right visualization for each type of data, and apply data storytelling principles so the key insights are quick to grasp.
Q5. How do you make sure a new dashboard is adopted and used effectively inside the company? To encourage adoption, it is essential to train the users, explain the logic behind each indicator, and demonstrate the added value of the dashboard. Continuous support and responsive technical assistance are also crucial for keeping engagement alive over the long term.
Custom Software Development: Which Part to Build
August 31, 2026
Custom software or an off-the-shelf package? The decision comes down to the slice of your work that falls outside your tools, and to the hours your people spend covering the gap.
Read more : Custom Software Development: Which Part to Build
How to Plan a Custom Software Project When Tech Is Not Your Trade
August 31, 2026
Handing your development firm a clear requirements brief is what lets it grasp your expectations and your context before it quotes your custom software project.
Read more : How to Plan a Custom Software Project When Tech Is Not Your Trade
Moving Company Software for Quebec and Canada
August 13, 2026
MFlow is moving company software that builds online quotes, takes credit card payments and texts your customer 48 hours before the move. On sale at the end of August 2026.
Custom Web Application Development Agency in Québec City and Lévis
August 13, 2026
A custom web application automates repetitive tasks, structures your operations and centralizes your data. Here is how our agile team in Québec City and Lévis designs, builds and scales one with you.
Read more : Custom Web Application Development Agency in Québec City and Lévis
SEO Agency in Québec City: Rank Higher, Win More Local Customers
July 1, 2026
Working with an SEO agency in Québec City is how local businesses climb Google. Inside: audits, keyword research, content, backlinks and 9 years of Quebec expertise from CyberPerformance.
Read more : SEO Agency in Québec City: Rank Higher, Win More Local Customers
360 Virtual Tour Photographer: Immersive Tours for Your Business
July 1, 2026
A Google-certified 360 virtual tour photographer turns your space into an immersive tour published straight to Google Maps, lifting your local visibility, your engagement and your sales.
Read more : 360 Virtual Tour Photographer: Immersive Tours for Your Business

 Get in touch